Key Takeaways
Takeaways: Shifting to Continuous Feedback
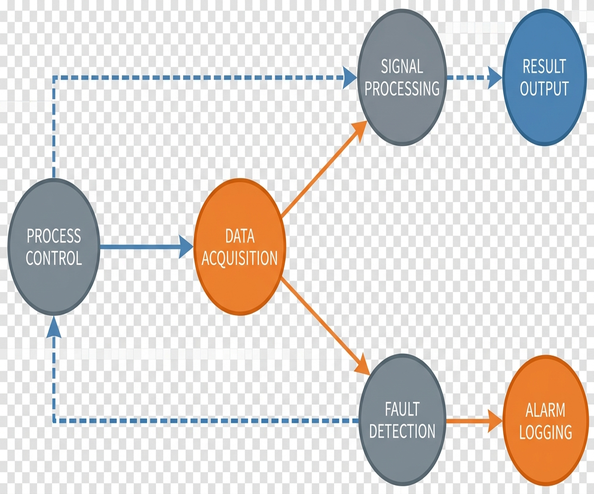
Annual external audits confirm a moment in time. They do not run the plant between visits. Analyzing historical non-conformance recurrence rates between annual audit windows reveals a stark contrast in process control. Audit windows spanning 3 to 5 days provide a static snapshot of compliance. Feedback loops operating on 12- to 24-hour review cycles maintain actual operational stability.
Non-conformance trends, hygiene results, internal audits, and CAPA form a single feedback loop. Trend review cadence matters more than any single finding volume.
From Inspection Days to Calendar Audits
Packaging quality control moved from buyer walk-throughs and lot inspection to formalized third-party schemes during transition periods spanning the late 1990s to the mid-2000s. Retailer mandates drove this shift. Standardizing supplier expectations reduced redundant buyer walk-throughs across the industry.
Standardized audit schedules occurring every 9 to 12 months became the dominant compliance rhythm. This history trained plants to organize evidence around visit dates rather than daily process control. Foundational ISO 9000 definitions of quality emphasize continuous control over episodic inspection, yet the calendar audit often dictates plant behavior.
Where the Annual Audit Cycle Falls Short
A gap exists between audit-day readiness and the months of drift that follow a clean report—a period where control slowly degrades. Drift accumulation periods of 4 to 6 months post-audit degrade process stability. Historical defect logs confirm as much.
Print defect tolerances shift by roughly 0.5mm to 1.2mm before detection. Common failure modes include static procedures and findings closed on paper only. Pre-audit clean-ups masking systemic adhesive failures represent a significant risk. These patterns link directly to real packaging risks for FMCG customers.
Reading Non-Conformance Trends as Operational Signal
Non-conformance logging functions as a continuous data stream across print, converting, sealing, and outbound checks. Grouping findings by process step, shift, material lot, and customer specification provides actionable intelligence.
Correlating adhesive open-time issues with seasonal humidity changes established the threshold for triggering a process review. Seasonal humidity shifts of around 15% to 22% relative humidity correspond with adhesive open-time variations of 1.5 to 3 seconds, as observed in our testing. This moves the system away from severity-only triggers to frequency-based alerts.
Hygiene Monitoring as a Living Control Layer
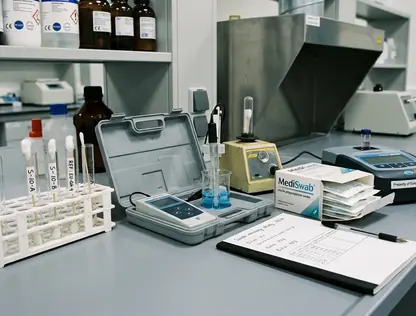
Environmental and contact-surface monitoring serves as continuous input. Mapping the physical contact zones where forming shoulders and ink kitchens intersect with exposed product surfaces determined the selection of sampling points on the packaging line.
Swab testing intervals of 48 to 72 hours provide ongoing data. Out-of-trend hygiene results reopen cleaning validation. Re-validation protocols require 3 consecutive clean shifts.
Warning: Calibrating Swab Baselines
Environmental monitoring baselines must be calibrated specifically to the risk class of the packaging material being run, as primary food-contact films require different thresholds than secondary corrugated shippers.
Internal Audits and Corrective Actions That Compound
Internal audits timed to process change, new tooling, and complaint spikes yield better data than those scheduled only to feed the external visit. When designing the CAPA workflow, routing all corrective actions exclusively through the quality department for closure proved inefficient.
A cross-functional approach handles complaint spikes involving 3 to 5 related SKUs more effectively. CAPA effectiveness verification windows of 14 to 30 days ensure solutions hold. Integrating ISO 9001 quality management principles ensures root cause analysis extends beyond operator error. Closed-loop CAPA provides a proven method to reduce repeat non-conformances across similar lines.
Designing Compliance as One Continuous Improvement Loop
Assembling non-conformances, hygiene, internal audits, and CAPA into a single operating cadence creates a strong system. Aligning daily floor signals with weekly triage meetings structures the operating cadence. Weekly triage meetings lasting 30 to 45 minutes keep teams focused. Quarterly system effectiveness checks spanning 2 to 3 shifts validate the overall structure.
Miko Pac operates certified production sites across Belgium, Poland and Germany, demonstrating how multi-site European groups require localized trend thresholds rather than corporate averages. Miko-Hordijk Verpackungen GmbH, a German subsidiary, exemplifies how localized control integrates with broader standards. A plant organized around process stability metrics outperforms one organized around audit dates.
What Resilience Looks Like When the Auditor Is Not There
A shift lead who can name last month’s top non-conformance family without opening a binder demonstrates true system resilience. Compliance that only peaks for the annual visit is a brittle control. Tracing unresolved minor print non-conformances directly to downstream filling line stoppages at customer facilities solidifies the conclusion that compliance is supply-chain continuity work.
Minor print non-conformances reappearing 3 to 5 weeks later directly trigger filling line stoppages lasting 45 to 90 minutes. A single recurring print defect can therefore idle a customer's filling line for well over an hour—the clearest proof that between-audit process control is where compliance actually earns its keep.